SEO Audit Report Template: What to Include and What Clients Read
Key Takeaways
- Most audit reports fail because they dump raw crawler data without context — the client does not know what matters
- An effective template has 5 sections: executive summary, scored categories, prioritized findings with fixes, competitive benchmark, and next steps
- Severity scoring (critical / high / medium / low) is what turns a data dump into an action plan
- Automating the report structure eliminates formatting labor and guarantees consistency across every client
A 90-page crawl export lands in the client's inbox. It lists every URL, every status code, every missing alt tag. The client opens it, scrolls for two minutes, and closes it. Nothing happens. Three weeks later they ask: "So what should we actually fix first?"
That is the failure mode of most SEO audit reports — and it has nothing to do with the quality of the crawl data. The data is fine. The structure is the problem. A useful SEO audit report template does not organize findings by what the crawler found. It organizes them by what the client should do, in what order, and why each fix matters to their revenue.
The difference between a report that gets shelved and one that drives action comes down to three structural decisions: what sections to include, how to score severity, and how to present fixes so a developer or marketing manager can act on them immediately.
Why Most Audit Reports Get Ignored
Audit tools generate data. Clients need decisions. The gap between those two things is where most reports fail.
A typical Screaming Frog or Sitebulb export gives you every crawled URL with its status code, canonical tag, meta title length, word count, and internal link count. That is useful for the SEO analyst running the audit. It is useless for the VP of Marketing who needs to decide where to allocate the next sprint's engineering resources.
The problem has three layers:
- No prioritization — 200 findings listed alphabetically or by URL tells the client nothing about which ones cost the most traffic
- No context — "missing H1 tag on /products/widget-3" means nothing without explaining that H1 tags influence how Google understands page topic, and that this specific page targets a keyword with 2,400 monthly searches
- No next step — finding a problem without explaining the fix creates a second project: figuring out what to do about it
A Backlinko analysis of 11.8 million Google search results found that the average first-page result loads in 1.65 seconds. That number is meaningless in a report unless the client's own page speed sits next to it for comparison. Raw benchmarks need client-specific context or they become trivia.
The fix is structural, not cosmetic. A better report template does not just look nicer — it reorganizes the same crawl data around the client's ability to act on it.
The 5-Section Template That Clients Act On
Every effective audit report follows the same structure, whether it is a 5-page quick fix or a 30-page deep audit. The five sections below cover what decision-makers need, what implementers need, and what bridges the two.
| Section | Audience | Purpose | Length |
|---|---|---|---|
| 1. Executive Summary | Decision-maker (CMO, VP) | Overall score, top 3 risks, estimated impact | 1 page |
| 2. Category Scores | Both | Visual breakdown: technical, on-page, speed, mobile, content | 1-2 pages |
| 3. Prioritized Findings | Implementer (dev, SEO) | Each issue with severity, affected URLs, fix instruction | 5-15 pages |
| 4. Competitive Benchmark | Decision-maker | Client vs. top 3 competitors on same metrics | 1-2 pages |
| 5. Recommended Next Steps | Both | Phased action plan: week 1, month 1, quarter 1 | 1 page |
See this template in action: open the live demo — the Audit Report tab shows severity-scored findings with evidence and fix code for each issue.
Section 1: Executive Summary. One page maximum. The overall health score (out of 100), the three most revenue-impactful findings, and a plain-language paragraph explaining what these mean for the business. The VP reads this and decides whether to fund the fixes. Everything below this section supports that decision.
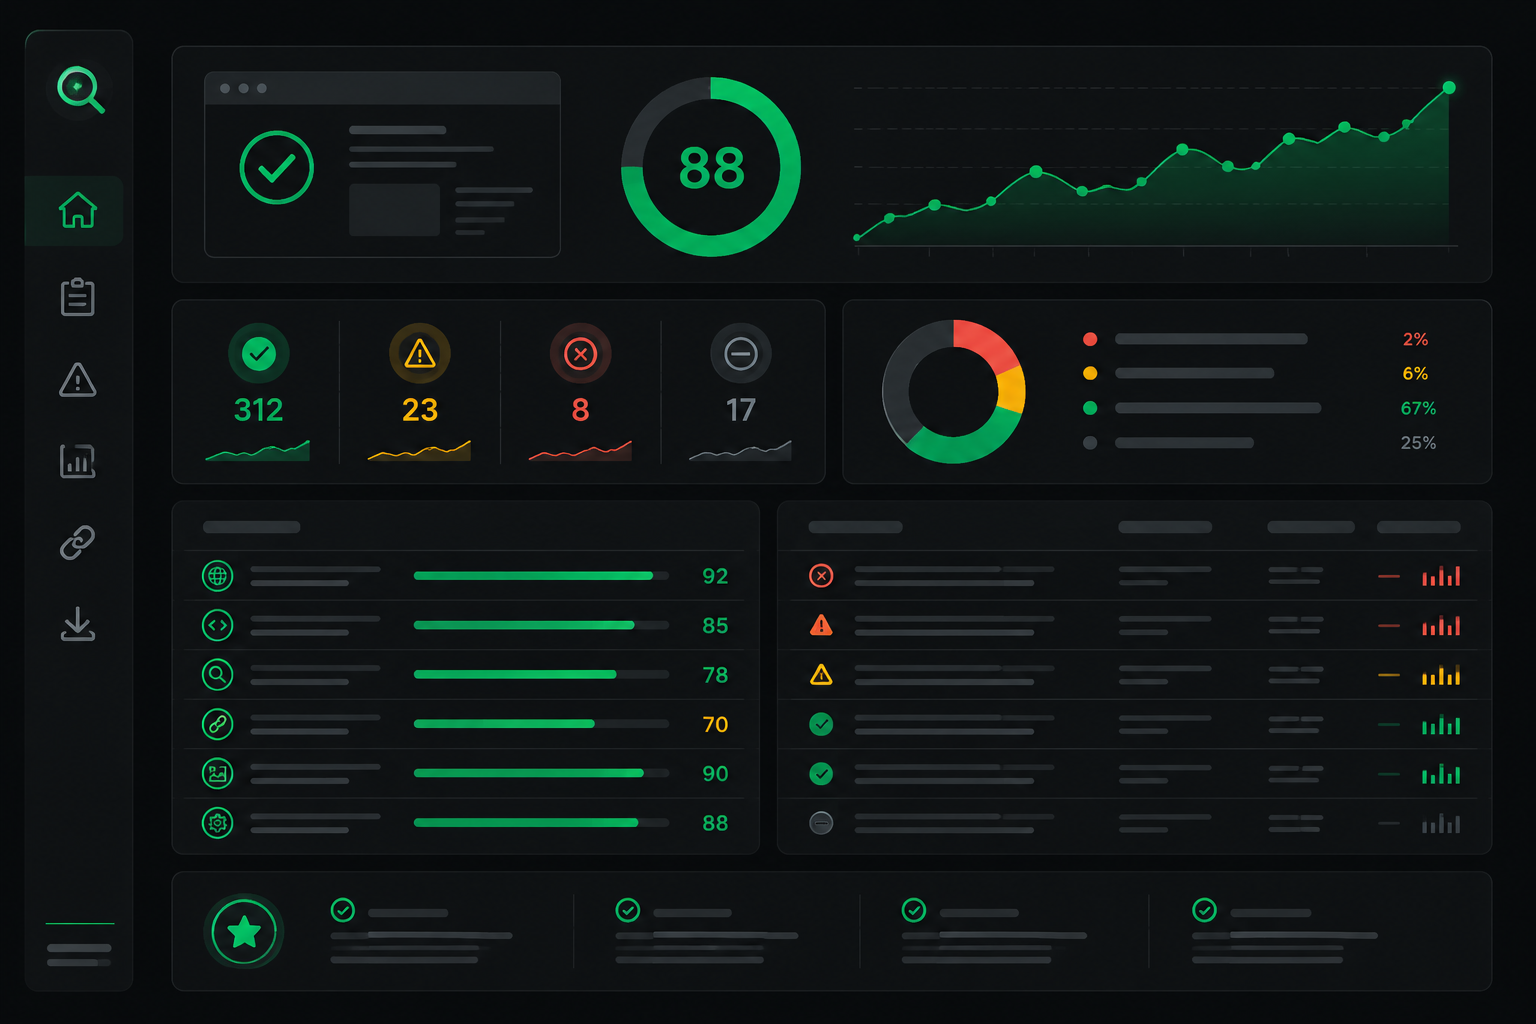
Section 2: Category Scores. Break the audit into 5-6 scored categories: technical health, on-page SEO, page speed and Core Web Vitals, mobile usability, content quality, and (increasingly) AI search readiness. A donut chart or bar graph per category lets the client see where they are strong and where they are weak at a glance — the MendMySEO demo shows this as six scored dimensions (Performance at 72/C, On-Page SEO at 74/C, Content Quality at 85/B, and so on), each with a trend line so the client sees direction, not just a snapshot. This section answers "where are the problems?" before the next section answers "what are the problems?"
Section 3: Prioritized Findings. The core of the report. Each finding gets a severity level (critical, high, medium, low), the affected URLs, a plain-language explanation of why it matters, and a specific fix instruction. "Missing canonical tags on 23 product pages" is a finding. "Add <link rel='canonical' href='...'> to the <head> of each product template — here is the code" is a fix. The gap between those two determines whether the report generates action — the demo's Audit Report shows an example of findings structured this way.
Section 4: Competitive Benchmark. Pull the same metrics for the client's top 3 competitors. This section creates urgency that internal data alone cannot. "Your page speed is 3.8 seconds" is a data point. "Your page speed is 3.8 seconds; your top competitor loads in 1.4 seconds" is a business problem. A SERP battle map, for example, lays out each competing domain's content strengths and exploitable gaps side by side — so the benchmark drives content decisions, not just anxiety.
Section 5: Recommended Next Steps. A phased action plan. Week 1: fix the critical items (broken redirects, missing canonicals, server errors). Month 1: address high-severity issues (page speed, mobile usability, thin content). Quarter 1: tackle strategic improvements (content gaps, link building targets, AI search optimization). This section turns the audit from a diagnosis into a project plan.
Automate the Structure, Personalize the Insight
Building this 5-section template manually for every client takes 4-8 hours of analyst time. The crawl runs for 30 minutes. The other 3.5-7.5 hours go to formatting, screenshot gathering, writing explanations, and assembling the PDF.
That time ratio is inverted from where it should be. The crawl and categorization — the mechanical parts — should be automated. The analyst's time should go to the parts that require judgment: interpreting the competitive benchmark, prioritizing findings based on the client's specific business goals, and writing the executive summary in language the decision-maker understands.
Automated SEO reporting platforms handle the first three sections almost entirely: they crawl, score, categorize, and generate the findings list with severity ratings. A white-label SEO audit report adds your branding on top. What the analyst adds — the competitive analysis context, the business-specific prioritization, the "here is why this matters for your Q3 revenue target" framing — is the value layer that justifies the price.
This split also solves a consistency problem. When reports are assembled manually, the quality varies by analyst, by day of the week, by how many reports are due that month. An automated template guarantees that every client gets the same thorough structure. The analyst's personalization improves the report; it does not determine whether the report is complete.
According to Google's guidelines on helpful content, content should demonstrate first-hand experience and depth of knowledge. The same principle applies to audit reports: the template provides depth (80+ checks, nothing missed), while the analyst adds experience (interpreting what the data means for this specific client).
MendMySEO generates the full 5-section report structure automatically — 80+ checks, severity scoring, category breakdowns, and paste-ready fix code — so your team spends time on insight, not formatting. Join the waitlist.
Frequently Asked Questions
What is the ideal length for an SEO audit report?
It depends on the audit tier. A quick fix report should be 5-8 pages: executive summary, scored categories, and the top 10-15 prioritized findings. A full deep audit runs 20-30 pages and includes competitive benchmarks, content gap analysis, and a phased action plan. Longer is not better — a 90-page report with no prioritization is less useful than a 10-page report where every finding has a severity score and a fix instruction.
Should I include raw crawler data in the report?
Not in the main report. The client-facing document should contain interpreted findings with severity, context, and fixes. If the client's development team wants raw data (full URL lists, status code tables, redirect chain maps), attach it as an appendix or provide a link to the hosted crawl report. Mixing raw data into the narrative sections buries the actionable insights.
How do I score audit categories?
Use a 0-100 scale per category (technical health, on-page SEO, page speed, mobile, content). Weight the score by issue severity: a critical issue (broken redirect chain affecting 500 pages) drops the score more than a low-severity issue (missing alt text on one image). The overall score is a weighted average of all categories. This gives the client one number to track over time.
What makes a good competitive benchmark section?
Pull the same 5-6 category scores for the client's top 3 organic search competitors — not their business competitors, their SERP competitors (the sites ranking for their target keywords). Show the comparison as a simple table: client score vs competitor scores per category. The gap between the client's weakest category and the competitor's strongest in that same category is the most urgent finding in the report.
Can I automate the entire audit report?
You can automate 70-80% of it: the crawl, categorization, scoring, findings list, and severity ratings. The remaining 20-30% should be human: the executive summary interpretation, competitive context, business-specific prioritization, and recommended next steps tailored to the client's goals and resources. Fully automated reports are fast but generic. The human layer is what justifies charging $500-2,500 instead of $0.